The domain is a set of numbers that determine what are the input values we can use in an equation. The range on the other hand is the set of output values that we could possibly get.
Often when expressing the domain and range of functions in the form of equations, we use interval notation and set-builder notation. To review...
Set-builder notation is a method where you specify a set of elements that satisfy a certain condition. It takes the form {x∣statementaboutx} which is read as, "the set of all x such that the statement about x is true." An example of this notation is {x∣x>15} which is a set of numbers greater than 15.
Interval notation is a method where you describe a set using a lower limit and upper limit. The endpoint values are listed between brackets or paranthesis. A square bracket indicates inclusion in the set, and a parathesis indicates exclusion from the set. An example of this notation is (−∞,5] which is a set of numbers less than or equal to 5.
Functions in algebraic form do not always have a domain which includes the set of all real numbers because there are restrictions in algebra like getting an even root of a negative number or dividing by zero.
Oftentimes, in order to find the domain of a function, we need to look at three cases...
If a function has no denominator, has a odd root or no root at all then the domain could be the set of all real numbers.
If the function has a denominator, then we need to exclude values in the denominator that force the denominator to be zero.
If there is an even root, then we need to exclude values that would make the radicand negative.
Example
Find the domain of the function f(x)=2−xx+1.
There is a denominator in this function so we need to verify that it does not equal zero.
When using a graph, we must note that the domain of a graph consists of all the input values shown on the x-axis. On this other hand, the set of possible output values which are shown on the y-axis. If there is a open dot on the graph then we exclude that value from the function and so we exclude it from the domain and range. If there is a shaded dot anywhere in the graph, we also include it in the function meaning we add it to the domain and range of the function.
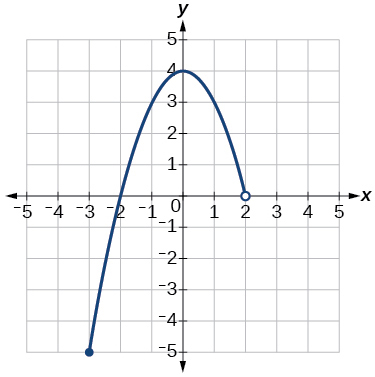
Fig. 1 - Graph using Open Dot
Example
The graph in figure dot does not go to infinity because it has endpoints. The endpoints are (−3,−5) and (2,0).
We want to include (−3,−5) in the domain and range because it has a closed dot but we do not want to include (2,0) because it has an open dot. This means the domain is [−3,2).
The greatest y-value is 4 and the smallest y-value is −5 on the graph. This means the range is [−5,4].
A piecewise function is a function in which more than one formula is used to define the output over different pieces of the domain. The notation of this idea is...
f(x)=⎩⎨⎧formula 1formula 2formula 3if xis in domain 1if xis in domain 2if xis in domain 3
An example of a piecewise function is the absolute value function. The absolute value function written in piecewise form is...
∣x∣={x−xif x≥0if x<0
When graphing a piecewise function, we need to indicate on the x-axis the boundaries defined by the intervals on each piece of the domain. For each piece of the domain, we need to graph on that interval using the corresponding equation pertaining to that piece.
Example
Given the piecewise function:
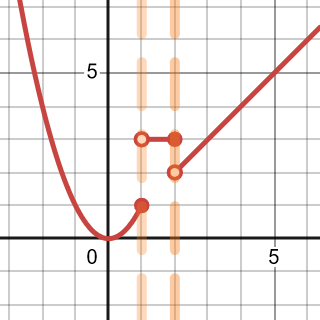
f(x)=⎩⎨⎧x23xif x≤1if 1<x≤2if x>2
Ignore the dashed lines in figure 2 as they are there to just indicate each piece of the domain. The graph of the function is...