Cartesian Coordinate System
The cartesian coordinate system also known as the rectangular coordinate system allows us to locate any object in a two-dimensional plane using just two numbers that denote the objects horizontal and vertical displacement.
Coordinate System
The cartesian coordinate system has two perpendicular axes where the horizontal axis is referred to as the x-axis and the vertical axis is referred to as the y-axis. The center of the plane where the two axes meet is the origin or the point . Finally, the axes are further divided into equal units where the numbers increase going up and to the right. This also means the numbers decrease going down and towards the left.
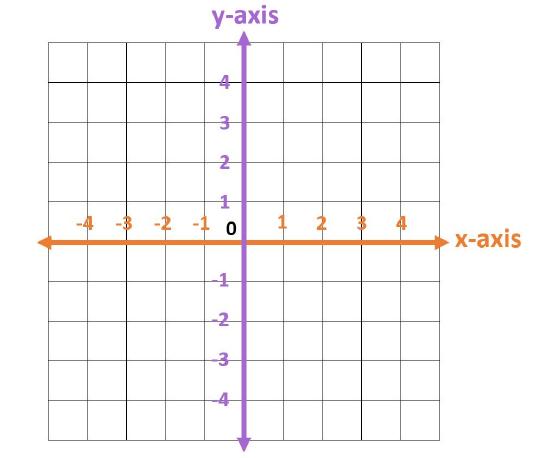
We put an arrow on each end of the axes to denote that the axes goes from negative infinity to infinity. The cartesian coordinate plane is infinite in size.
Each point in the plane is identified by its x-coordinate which is the horizontal displacement from the origin and the y-coordinate which is the vertical displacement from the origin. Together, we write them as an ordered pair in the form . This pair denotes the combined distance from the origin. For example, is a point units to the left and units up from the origin.
The axes divide the coordinate plane into four sections which we call quadrants and these quadrants are numbered counterclockwise from to .
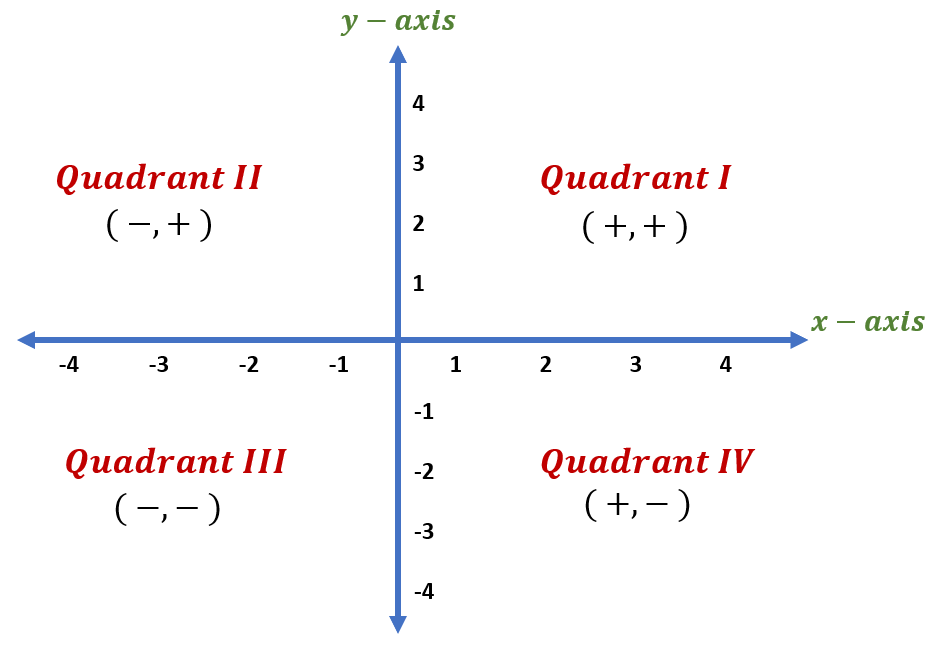
- All points in have positive and coordinates.
- All points in have negative coordinates and positive coordinates.
- All points in have negative and coordinates.
- All points in have positive coordinates and negative coordinates.
Graphing Equations
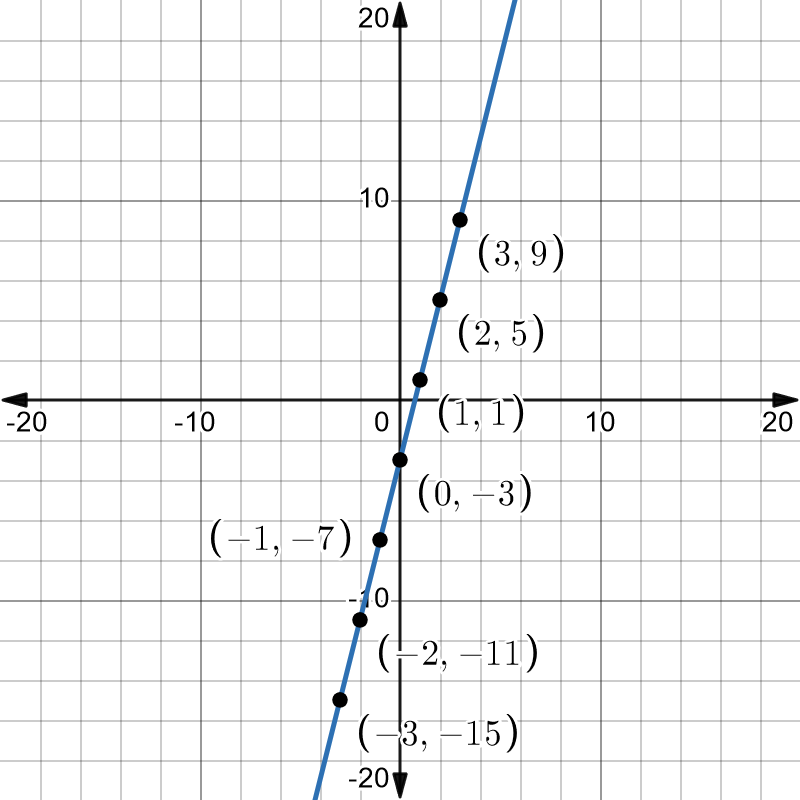
We can plot equations that contain both an variable and a variable on the coordinate plane using a set of points. We take an equation and substitute various values to obtain values from them. Each one of these and values represent a point. Finally, we plot these plots on the plane and connect them to form a line. Not all equations may be able to form a line.
Lets plot the equations ...
Plottings these points gives us the graph...
Intercepts
The intercepts of a graph are the points where a given graph crosses an axes. The x-intercepts are points where the graph crosses the axis and the y-intercepts are points where the graph crosses the axis.
When the graph crosses the axis, the coordinate equals and when the graph crosses the axis, the coordinate equals . Knowing this fact, we can find the intercepts by substituting for in the equation. This also applies for intercepts which can be found by substituting for in the equation.
Formulas
The distance formula is derived from the Pythagorean Theorem and is used to find the distance between two points in the plane. The distance formula is where the ordered pairs are and where the ordered pairs aree and .
The midpoint formula is used to find the point that is midway between two given points. The formula is .
A line segment is a line that has two endpoints meaning it has a defined end. The points we use for the midpoint formula are these endpoints and through the formula, we essentially find the middle of the line segment.