We have already defined the trigonometric functions in terms of unit circles. Recall that these functions relate real number values to the x and y coordinates of a point on the unit circle. This means that we can also graph these functions on a coordinate plane which gives us another way to visualize and analyze these functions.
Let's start with the sine function. To graph this function, we need to create a table of values for x and y.
x
0
6π
4π
3π
2π
32π
43π
65π
π
sin(x)
0
21
22
23
1
23
22
21
0
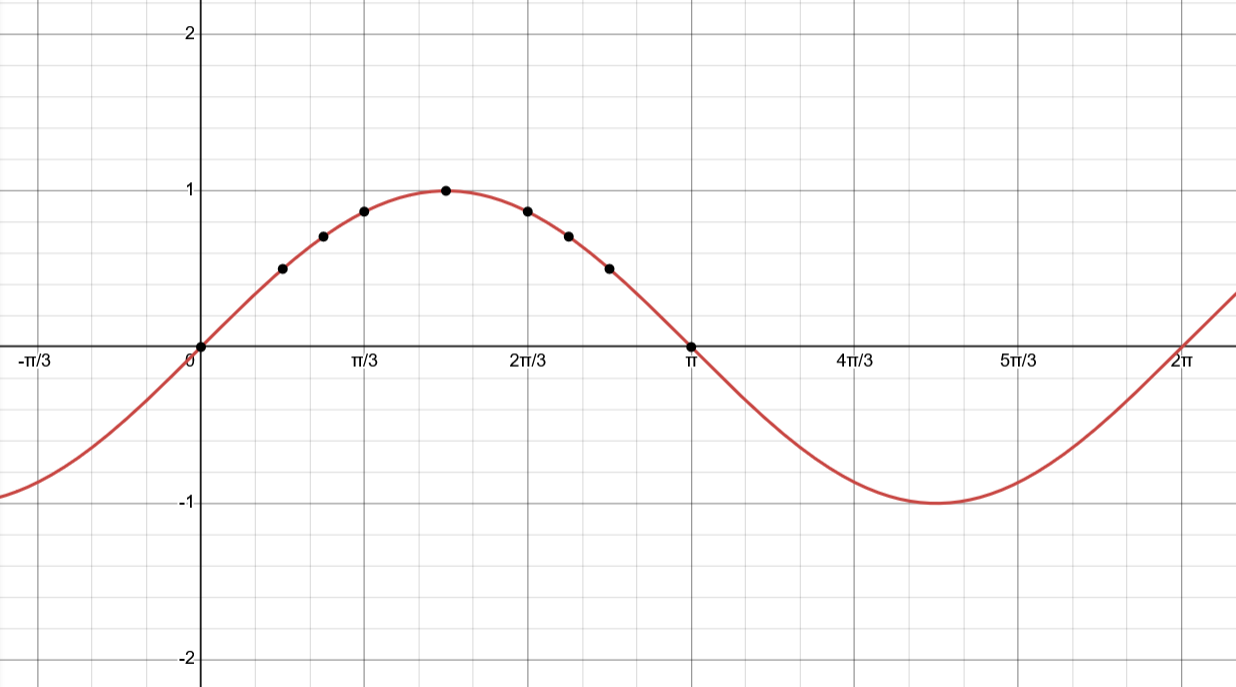
Plotting these points on a graph gives us the following graph...
Fig. 1 - Sine Function
note
The sine values are positive between 0 and π which corresponds to the values of the sine function being positive in the first and second quadrants of the unit circle. In the same way, the sine values are negative between π and 2π which corresponds to the values of the sine function being negative in the third and fourth quadrants of the unit circle.
We can also graph the cosine function in a similar way. To graph this function, we need to create a table of values for x and y.
x
0
6π
4π
3π
2π
32π
43π
65π
π
cos(x)
1
23
22
21
0
−21
−22
−23
−1
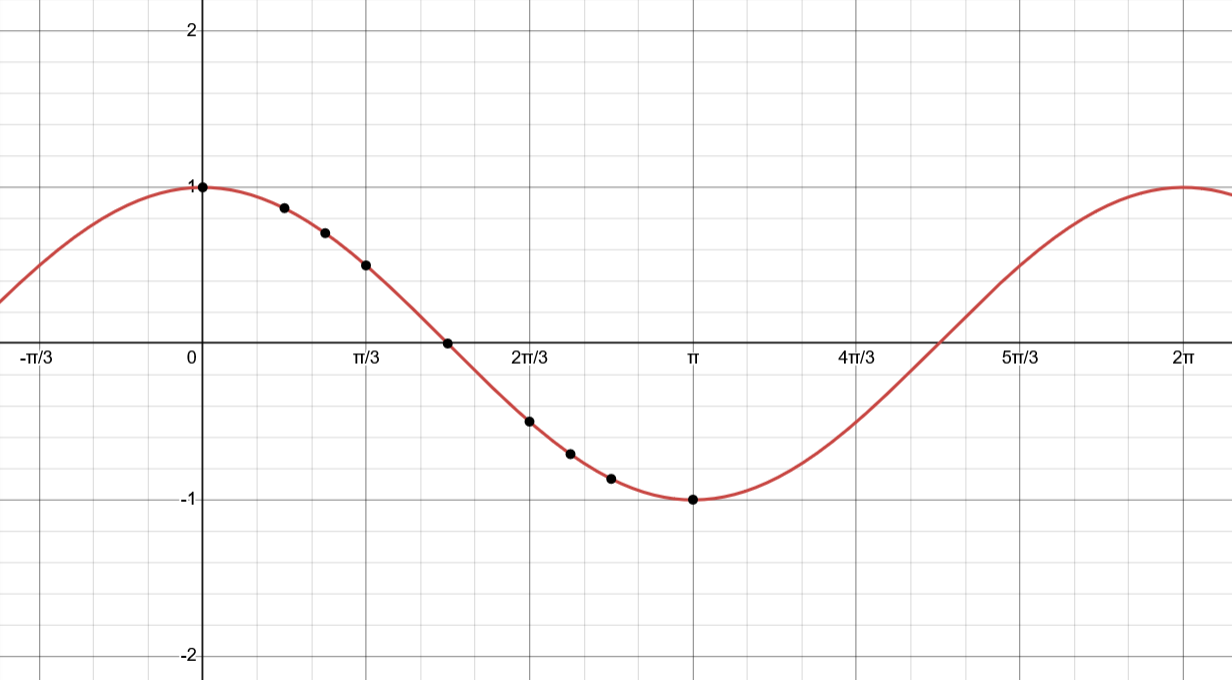
Plotting these points on a graph gives us the following graph...
Fig. 2 - Cosine Function
note
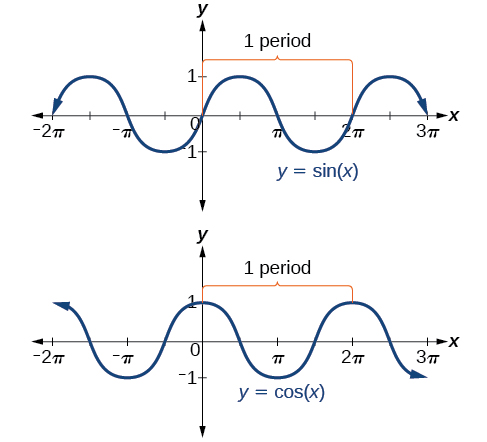
Now that we have graphed the sine and cosine functions, the domain and range is more apparent. The domain of both functions is (−∞,∞) while the range is [−1,1].
It is also apparent that the sine function is an odd function because it is symmetric about the origin. On the other hand, the cosine function is an even function because it is symmetric about the y-axis.
Both the shapes of the sine and cosine graphs repeat after 2π units which means the functions are periodic with a period of 2π. A periodic function in general is a function for which a horizontal shift, P, results in f(x+P)=f(x) for all x in the domain of the function. The period of a periodic function is the smallest positive number P for which this is true. The period is the smallest such horizontal shift with P>0.
A sinusoidal function is a function that has a general shape of a sine wave and both the sine and cosine functions are examples of sinusoidal functions. The general forms of sinusoidal functions are y=Asin(Bx+C)+D and y=Acos(Bx+C)+D where A, B, C, and D are constants.
note
The curves of sinusoidal functions are not necessarily identical as some can be taller or longer than others.
From the general forms of the sinusoidal functions, we can deduce that they are transformations of the sine and cosine functions and we can determine how each constant affects the graph of the function accordingly.
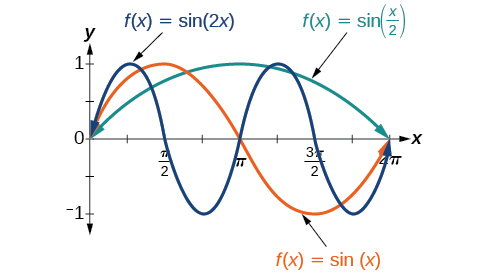
In the general formula, B is related to the period as P=∣B∣2π. If ∣B∣>1, then the period is less than 2π and the graph is compressed horizontally. If ∣B∣<1, then the period is greater than 2π and the graph is stretched horizontally. Finally, if B=1, then the period is 2π.
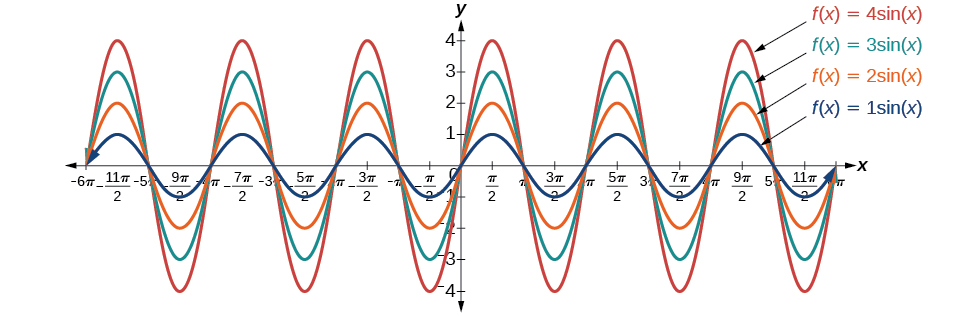
Other than horizontal compression and stretch, the graph can also be vertically compressed or stretched. In the general formula, A relates to the amplitude or the greatest distance from rest. The value of A directly represents the vertical stretch factor, and ∣A∣ is the amplitude of the function. This means that the local maxima will be ∣A∣ units above the horizontal midline of the graph and the local minima will be ∣A∣ units below the horizontal midline where the midline is the horizontal line that passes through the center of the graph and is given by y=D.
Also note that if ∣A∣>1, then the graph is stretched vertically. If ∣A∣<1, then the graph is compressed vertically. Finally, if A=1, then the amplitude is 1.
Fig. 5 - Amplitude of Sinusoidal Functions
note
Due to the amplitude being the vertical height from the midline, we can also find the amplitude using the formula ∣A∣=21∣max−min∣ where the max and min are the maximum and minimum values of the function respectively.
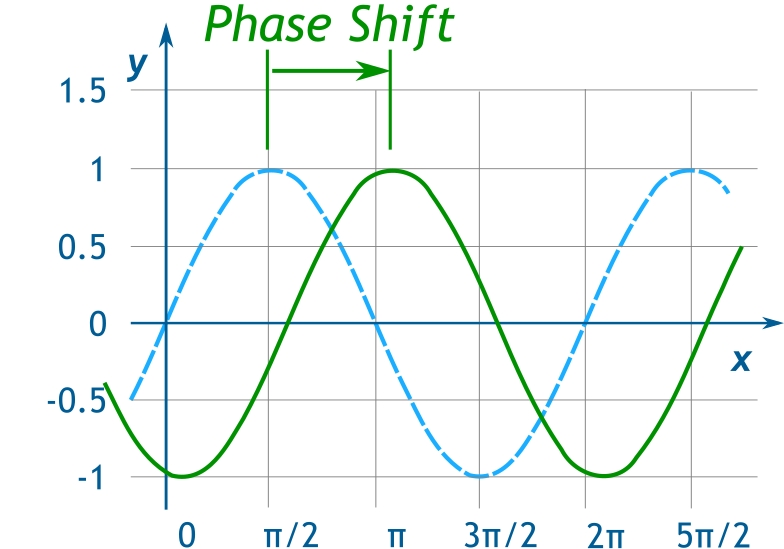
Before we explore the phase shift, let's slightly modify the general forms of the sinusoidal functions from y=Asin(Bx−C)+D and y=Acos(Bx−C)+D to y=Asin(B(x−BC))+D and y=Acos(B(x−BC))+D. This is because the value of BC represents the phase shift which is the horizontal shift of the graph. If C>0, then the graph is shifted to the right by ∣C∣ units and if C<0, then the graph is shifted to the left by ∣C∣ units.
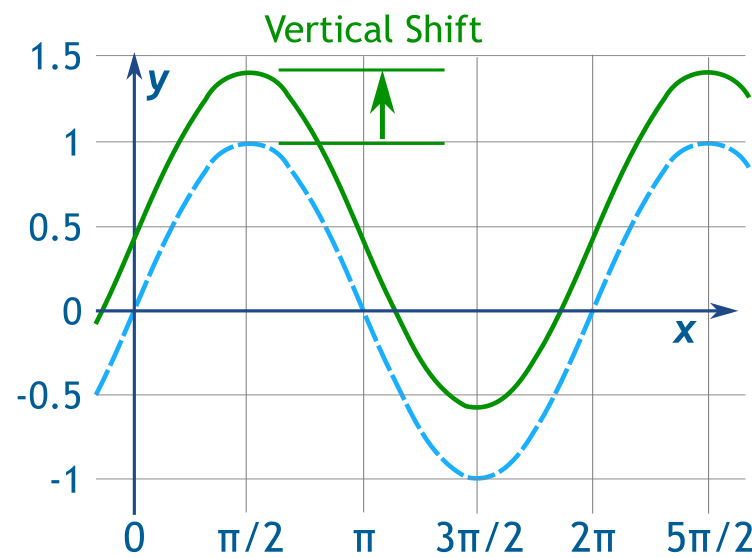
Finally, the value of D indicates the vertical shift of the graph which is the vertical translation of the graph. If D>0, then the graph is shifted up by D units and if D<0, then the graph is shifted down by ∣D∣ units.
Given a sinusoidal function in the form y=Asin(Bx−C)+D or y=Acos(Bx−C)+D, we can find the period, amplitude, phase shift, and midline using the following formulas...
The amplitude is ∣A∣.
The period is ∣B∣2π.
The phase shift is BC.
The midline is y=D.
Given the function y=Asin(Bx−C)+D, we can sketch the graph by following these steps...
Find the amplitude and period.
We will graph y=sin(Bx) first and then will apply the phase shift and vertical shift.
Start at the origin, with the function increasing to the right if A is positive and decreasing to the right if A is negative.
At x=2∣B∣π, the function will reach a local maximum if A>0 and a local minimum if A<0.
The curve returns to the x-axis at x=∣B∣π.
There is a local minimum for A>0 and a local maximum for A<0 at x=2∣B∣3π with y=−A.
Finally, the curve returns to the x-axis at x=∣B∣2π.
The rest of the graph can be sketched by following the same pattern.
Now that we have the graph of y=sin(Bx), we can apply the phase shift of BC units to the right if C>0 and to the left if C<0.
Finally, we can apply the vertical shift of D units up if D>0 and down if D<0.
An example of this is shown below...
Example
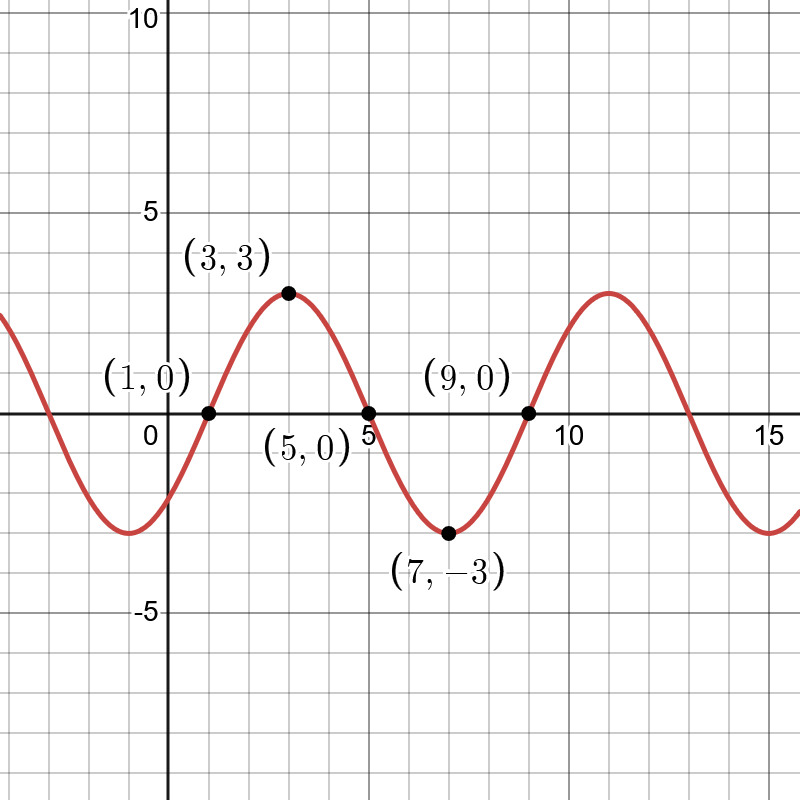
Sketch a graph of f(x)=3sin(4πx−4π).
The amplitude of the function is ∣A∣=3 and the period is ∣B∣2π=4π2π=8.
Starting at the origin the first point is (0,0) and the function increases to the right because A>0.
At x=2∣B∣π=2(4π)π=2, the function reaches a local maximum of A=3. This point is (2,3).
At x=∣B∣π=4ππ=4, the function returns to the x-axis. This point is (4,0).
At x=2∣B∣3π=2(4π)3π=6, the function reaches a local minimum of −A=−3. This point is (6,−3).
Finally, at x=∣B∣2π=4π2π=8, the function returns to the x-axis. This point is (8,0). After this the pattern repeats.
Now we can apply the phase shift of BC=4π÷4π=1 units to the right. This means the new points are (1,0), (3,3), (5,0), (7,−3), and (9,0).
Finally, there is no vertical shift because D=0 so we can use the points to sketch the graph.
We can use the transformations of sine and cosine functions in numerous applications especially anything related to circular motion.
Example
The London Eye is a huge Ferris wheel with a diameter of 135 meters (443 feet). It completes one rotation every 30 minutes. Riders board from a platform 2 meters above the ground. Express a rider's height above the ground as a function of time in minutes.
With a diameter of 135 meters, the radius of the Ferris wheel is 67.5 meters. This means the height will osciallate between 67.5 meters above and below the center. This means the amplitude is 67.5 meters.
The passengers board 2 meters above the ground which means the center of the wheel is located 67.5+2=69.5 meters above the ground. This means the midline of the oscillation will be at 69.5 meters.
The wheel also takes 30 minutes to complete one revolution which means the period is 30 minutes.
Finally, since the rider boards at the lowest point, the height must start at the smallest possible value and start increasing from there. This shape is the shape of a vertically reflected cosine function.
The information we have extracted from the problem are that the amplitude is A=67.5, the midline is D=69.5, the period is P=30, and the shape is −cos(t).
We can also find the value of B using the formula P=∣B∣2π which gives us 30=∣B∣2π. This means ∣B∣=302π=15π.
Putting all this information together, we get the function h(t)=−67.5cos(15πt)+69.5 where t is in minutes and y is measured in meters.